Hardware-Oriented
Pressure Transducer Training Platform
Aim
- To study the working and characteristics of a pressure transducer by analyzing its response to applied pressure.
- To understand the operation and application of a load cell for measuring force or weight, and to evaluate its performance.
Apparatus & Software
| Sl. No. | Component | Quantity |
|---|---|---|
| 1 | Scientech 2308M Pressure Transducer Training Platform | 1 |
| 2 | Air Compressor | 1 |
| 3 | Pressure Vessel | 1 |
| 4 | 4mm Patch Cord | As required |
Theory
A capacitive pressure transducer operates on the principle of change in capacitance due to deformation of a diaphragm when pressure is applied. It consists of a flexible sensing diaphragm placed between two fixed rigid plates (electrodes). When pressure is applied through a port, the sensing diaphragm deflects toward one of the plates, changing the gap d and hence the capacitance:
where ε is the permittivity of the medium between the plates, A is the plate area, and d is the distance between the plates. As applied pressure increases, d decreases, C increases, and this change is converted into an electrical signal (typically a 4–20 mA current output) using a bridge circuit and signal conditioning electronics.
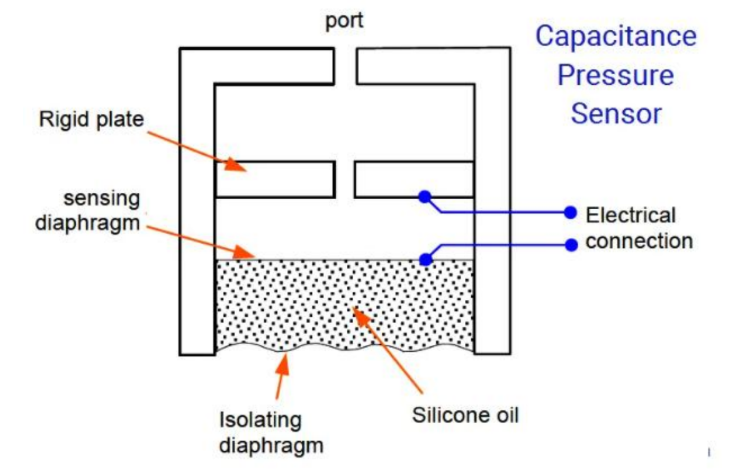
Figure 1: Capacitive pressure transducer internal structure.
A load cell is a transducer that converts mechanical force into an electrical signal. The most commonly used type is the strain gauge load cell, which works on the principle that the electrical resistance of a conductor changes when it is mechanically deformed. When a force is applied, the elastic element of the load cell deforms, producing strain in the attached strain gauges. The fractional change in resistance is related to strain by:
where ΔR is the change in resistance, R is the original resistance, G is the gauge factor, and ε is the strain. This small resistance change is measured using a Wheatstone bridge circuit, which converts it into a proportional output voltage (0–10 V range).
Pre-Lab / Circuit Diagram
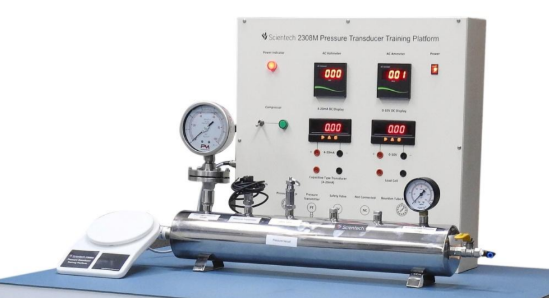
Figure 2: Experimental setup of the Scientech 2308M Platform.
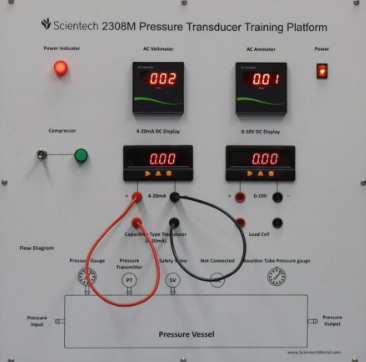
Figure 3: Circuit diagram of the pressure transducer setup.
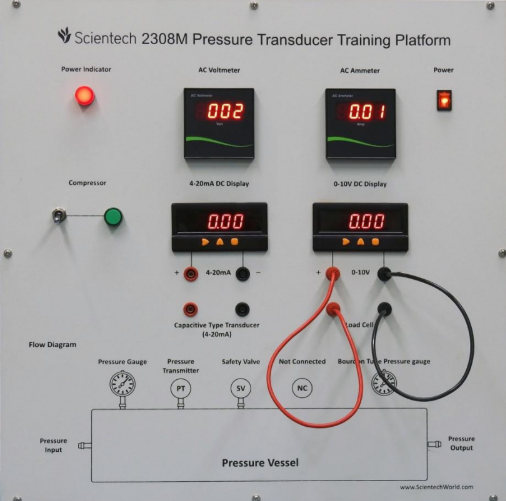
Figure 4: Circuit diagram of the load cell setup.
Procedure
Pressure Transducer Setup:
- Connect the experimental setup as per the given circuit diagram for the pressure transducer.
- Switch ON the compressor and connect its outlet to the pressure vessel using the PU tube.
- Allow air to fill the pressure vessel. Apply pressure in steps (5 psi, 10 psi, … up to 100 psi) using the compressor.
- For each pressure value, close the outlet valve to maintain constant pressure and record the corresponding output current from the 4–20 mA DC display.
- Tabulate all readings.
Load Cell Setup:
- Connect the load cell to the 0–10 V DC display as per the circuit diagram.
- Ensure no load is applied initially and note the zero-load output voltage.
- Gradually place known weights (50 g, 100 g, 150 g, … up to 1000 g) on the load cell platform.
- For each weight, record the corresponding output voltage from the display.
- After completing all observations, remove all weights and switch OFF the setup.
Simulation / Execution (Not Applicable)
This section is not required for this experiment.
Observations
Table 1: Pressure Transducer Characteristics — Output current (mA) vs applied pressure (psi).
| S. No. | Pressure (psi) | Transducer Output (mA) |
|---|---|---|
| 1 | 5 | 4.6 |
| 2 | 10 | 5.2 |
| 3 | 15 | 5.8 |
| 4 | 20 | 6.3 |
| 5 | 25 | 6.9 |
| 6 | 30 | 7.4 |
| 7 | 35 | 8.1 |
| 8 | 40 | 8.6 |
| 9 | 45 | 9.3 |
| 10 | 50 | 9.8 |
| 11 | 55 | 10.3 |
| 12 | 60 | 10.9 |
| 13 | 65 | 11.5 |
| 14 | 70 | 12.1 |
| 15 | 75 | 12.6 |
| 16 | 80 | 13.1 |
| 17 | 85 | 13.6 |
| 18 | 90 | 14.1 |
| 19 | 95 | 14.7 |
| 20 | 100 | 15.2 |
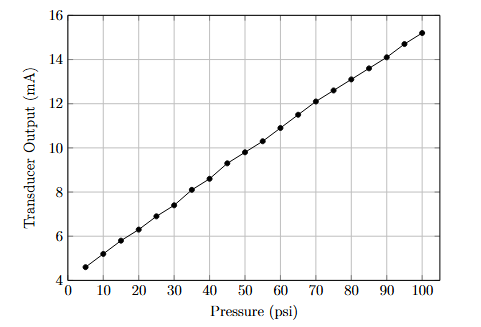
Figure 5: Pressure (psi) vs Transducer Output (mA) characteristic curve.
Table 2: Load Cell Characteristics — Output voltage (V) vs applied weight (g).
| S. No. | Weight (g) | Output Voltage (V) |
|---|---|---|
| 1 | 50 | 0.2 |
| 2 | 100 | 0.4 |
| 3 | 150 | 0.6 |
| 4 | 200 | 0.8 |
| 5 | 250 | 1.1 |
| 6 | 300 | 1.3 |
| 7 | 350 | 1.6 |
| 8 | 400 | 1.9 |
| 9 | 450 | 2.1 |
| 10 | 500 | 2.3 |
| 11 | 550 | 2.6 |
| 12 | 600 | 2.9 |
| 13 | 650 | 3.2 |
| 14 | 700 | 3.3 |
| 15 | 750 | 3.6 |
| 16 | 800 | 3.8 |
| 17 | 850 | 4.1 |
| 18 | 900 | 4.3 |
| 19 | 950 | 4.6 |
| 20 | 1000 | 4.8 |
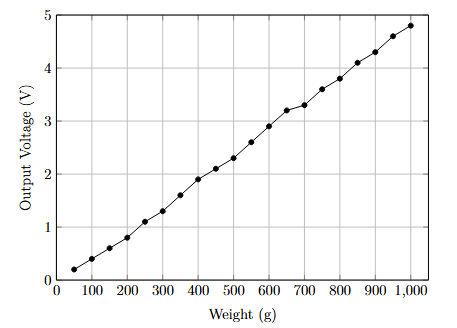
Figure 6: Load Cell Characteristics — Weight (g) vs Output Voltage (V).
Calculations
Pressure Transducer — Sensitivity calculated from extreme data points:
The standard 4–20 mA output range covers 16 mA over the full pressure span. The theoretical sensitivity for a 0–100 psi range would be 16/100 = 0.16 mA/psi. The measured sensitivity of 0.1116 mA/psi and offset of ~4 mA at low pressure are consistent with the 4–20 mA live-zero convention (4 mA at zero/minimum pressure, 20 mA at full scale).
Load Cell — Sensitivity calculated from extreme data points:
The load cell output varies from 0.2 V at 50 g to 4.8 V at 1000 g over the 0–10 V output range, giving a practical sensitivity of approximately 4.84 mV per gram.
Results & Analysis
- The capacitive pressure transducer output current increased linearly with applied pressure, from 4.6 mA at 5 psi to 15.2 mA at 100 psi, with a sensitivity of approximately 0.112 mA/psi, confirming the linear and reliable behaviour of the 4–20 mA pressure transmitter.
- The load cell output voltage increased nearly linearly with the applied weight, from 0.2 V at 50 g to 4.8 V at 1000 g, with a sensitivity of approximately 4.84 mV/g, validating the accuracy and proportional response of the strain gauge load cell.
- Both the pressure transducer and load cell exhibited stable and repeatable output readings at each measurement step, confirming their suitability for industrial pressure and force/weight measurement applications.
- The plotted characteristics (Figures 5 and 6) show clear linear trends for both devices across their respective measurement ranges.
Conclusion
The characteristics of the pressure transducer and load cell were successfully studied and analyzed using the Scientech 2308M platform. The capacitive pressure transducer demonstrated a linear increase in output current with applied pressure, confirming its reliability for pressure measurement. The load cell showed a nearly linear increase in output voltage with applied load, validating the accuracy and sensitivity of the Wheatstone bridge-based strain gauge measurement system. Both transducers performed as expected within their specified ranges, demonstrating their practical suitability for industrial instrumentation applications.
Post-Lab / Viva Voce
- Q: What is the working principle of a capacitive pressure transducer?
A: Applied pressure deflects a flexible diaphragm, changing the gap d between capacitor plates and hence the capacitance C = εA/d, which is converted to an electrical output. - Q: Why does the pressure transducer output 4 mA at zero pressure instead of 0 mA?
A: The 4–20 mA live-zero convention ensures that a broken wire (0 mA) can be distinguished from a zero-pressure reading (4 mA), enabling fault detection. - Q: What is the gauge factorgauge factorA dimensionless sensitivity parameter of a strain gauge defined as the ratio of fractional resistance change to the applied mechanical strain. Typical value for metal foil gauges is ~2. of a strain gauge, and what is its typical value for metallic gauges?
A: Gauge factor G = (ΔR/R) / ε is the ratio of fractional resistance change to strain; for metallic gauges it is typically around 2. - Q: Why is a Wheatstone bridge used in a load cell instead of a single strain gauge?
A: A full bridge with four active gauges (two in tension, two in compression) cancels temperature drift, doubles sensitivity, and produces a measurable differential voltage proportional to load. - Q: What is the difference between gauge pressure and absolute pressure?
A: Gauge pressure is measured relative to atmospheric pressure; absolute pressure is measured relative to a perfect vacuum (absolute pressure = gauge pressure + atmospheric pressure). - Q: Why is silicone oil used inside a capacitive pressure transducer?
A: Silicone oil transmits pressure uniformly from the isolating diaphragm to the sensing diaphragm and provides electrical insulation between the capacitor plates. - Q: What would happen to the load cell reading if the elastic element is strained beyond its elastic limit?
A: The elastic element would undergo permanent (plastic) deformation, causing a permanent zero-shift offset error and degraded linearity — the load cell would be permanently damaged. - Q: What causes the slight non-linearity observed in the load cell characteristic between 650 g and 700 g?
A: It arises from minor mechanical hysteresis in the elastic element, slight imperfections in weight placement on the cell, and creepcreepThe slow, time-dependent drift in sensor output under constant applied load, caused by mechanical relaxation in the sensing element or bonding material. in the adhesive bonding the strain gauges. - Q: What is the significance of the safety valve in the pneumatic circuit of this experiment?
A: The safety valve automatically releases pressure if it exceeds the rated limit of the vessel, preventing overpressure and potential burst of the pressure vessel. - Q: How would you calibrate the pressure transducer if its output does not read exactly 4 mA at zero pressure?
A: Apply zero pressure (open to atmosphere), measure the output offset, and adjust the zero-trim potentiometer on the transmitter until the output reads exactly 4 mA.
References & Resources (Not Applicable)
This section is not required for this experiment.
Was this experiment helpful?
Your feedback helps us improve
Please Sign In to rate this experiment.